Franchisee Success Dashboards
Role: Creative and Design direction, visioning, executive presentation, scope management, user research, design strategy and delivery management
Team: 2 Product Designers, 1 Project Manager, 1 Product Manager, 12 Engineers, 1 Scrum Master
About the Client
Restaurant Brands International Inc. (RBI) is one of the world’s largest quick-service restaurant companies with approximately $32 billion in annual system-wide sales and 27,000 restaurants in more than 100 countries and U.S. territories. RBI owns three of the world’s most prominent and iconic quick-service restaurant brands – TIM HORTONS, BURGER KING, FIREHOUSE SUBS and POPEYES. These independently operated brands have been serving their respective guests, franchisees, and communities for over 45 years.
Project Brief
RBI created a new scoring system to measure the success of franchisees. A set of 23 key performance management metrics were prioritized for a 2021 rollout. These metrics are designed to create a standard system to measure the performance of franchisees across North America for Burger King and Popeyes brands. The vision was to create a single franchisee-centric success management system that can serve multiple brands that would reduce IT spending per brand but still offer customization of metrics unique to brands.
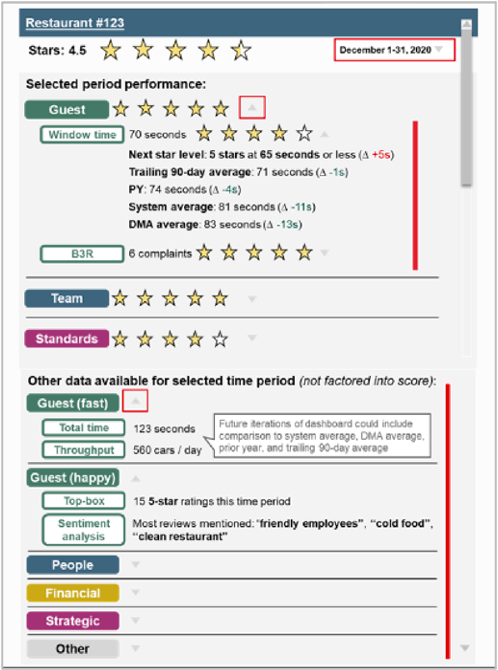
Client provided requirement
Goals
Deliver trusted Franchisee metrics seamlessly for Burger King and Popeyes Franchisees in North America.
Create mobile-friendly data visualization so that franchisees have fingertip access to this data
Metrics should be simple and easy to understand with transparency around how they are calculated
Up-to-date data allowing franchisees to course-correct performance when needed
Create branded high-quality applications to express high standards to the franchisees
Understanding Franchisee Needs
Franchisee segments
Small (1-2 Restaurants)
Very lean operations, often family-run with long-term associates (GM, Managers, Asst. Managers, Workers)
Mid size(3-15 Restaurants)
Have a structure in place with responsibilities mapped to a role, though often business is run without a central office. (DM, GM, Managers, Asst. Managers, Workers)
They are curious about their performance as compared to other franchisees and are trying to figure out how not to distract their employees from the flood of information that comes from the brands
Large (16-50 Restaurants)
They have a headquarter and have a focus on specific regions and states. Are organized and pay attention to all the channels of communication provided by the brands. Typically, executives maintain relationships with the field teams and staff escalates to the executives if they can’t figure out what to do. (Corp staff/facilities, Regional GMs, DM, Managers, Asst. Managers, Workers)
Corporate (50+ Restaurants)
They have a national presence and international franchisees will sometimes have rights to an entire country. Some are even publicly traded companies. (Board, Corp staff/facilities, Regional GMs, DM, Managers, Asst. Managers, Workers)
Often networked and connected to RBI sub-committees, planning, active in communication with RBI because they like to be in the know.
Exploration and Branding
We explored ways to present star ratings at restaurant level and franchisee level. With approaches like showing the breakdown, clicking to see the breakdown, seeing trends, seeing only problems first. This allowed us to determine the density of data points to present in these performance dashboards.
Design Sprints
Early hi-fidelity mockups to get executive sign-offs
Visualizing all the roll-up levels, district level, and restaurant-level views
Weekly design reviews and approval cycles
Developer hand-offs and design asset support
Popeyes Initial Concepts
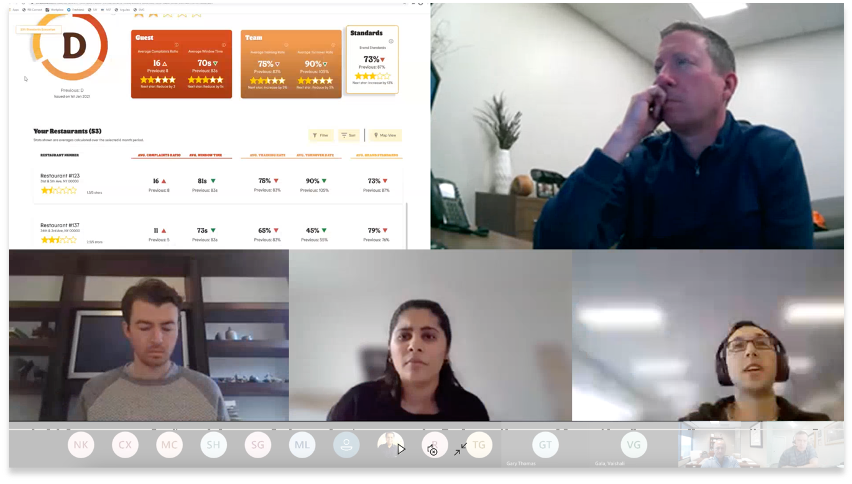
Usability testing
Every 3 sprints we would test the designs with the franchisees to get their feedback on clickable prototypes
Key Learnings
Brand color on the data visualization caused confusion on the performance of metrics as brand colors were too close to system colors.
Adding benchmark is important to show reference so that franchisees understand where they are in relation to other franchisees.
Give encouragement or rewards if the performance is good.
Franchisees are very detail-oriented and look for small details. They referenced excel sheets as their primary business tool.
They care more about who owns the region or restaurants so they can reach people concerned.
They want recommendations on how to improve if the performance was lower. What actions should be taken to course correct.
Multi-brand design System Driven Designs
We created design systems that could adopt to both company branding. Our designs visually simplified complex performance calculations and built indicators to explain all the thresholds as designed by the business to measure franchisees.
Popeyes Louisiana Kitchen


Burger King


