Drug Spend Intelligence Web App for McKesson
End consumers had been using an 8 year old legacy analytics tool to create reports and generate trends for purchased pharmacy supplies from McKesson. User base made up of experienced pharmacist and analysts asking for a modern and more powerful tool to give them immediate trends and detect purchasing patters so they could save money on bulk pharmacy purchases. We created 3 Tableau dashboards to analyze spending trends and purchasing patterns on a website. Our interdisciplinary lean team of a product manager, data visualization expert and designer used 4, 2-week sprints to discover, test and build our exploratory and reporting dashboards. Our designs were deployed by McKesson and got media coverage for releasing this SaaS tool and were able to expand the user base from a few 50 users to a 800+ users covering most of their active clients. As a result McKesson customers to take advantage of predicting supply needs and order bulk quantities that saved them from hundred's or thousands to some times up to a million dollars in drug purchases.
Current State analysis and Legacy IA Audit
Existing user base made up of experienced pharmacists, young analysts and pharmacy staff who were familiar with this tool in varied levels. Some users were very comfortable with the multi-step wizard and some found it cumbersome to use. Leadership had progressive ideas about expanding a close knit user base who answered specific purchasing trends for their customers to a self service analytics tool to about all their 800 customers at hospitals, clinics and pharmacy staff.
Wireframe exploration
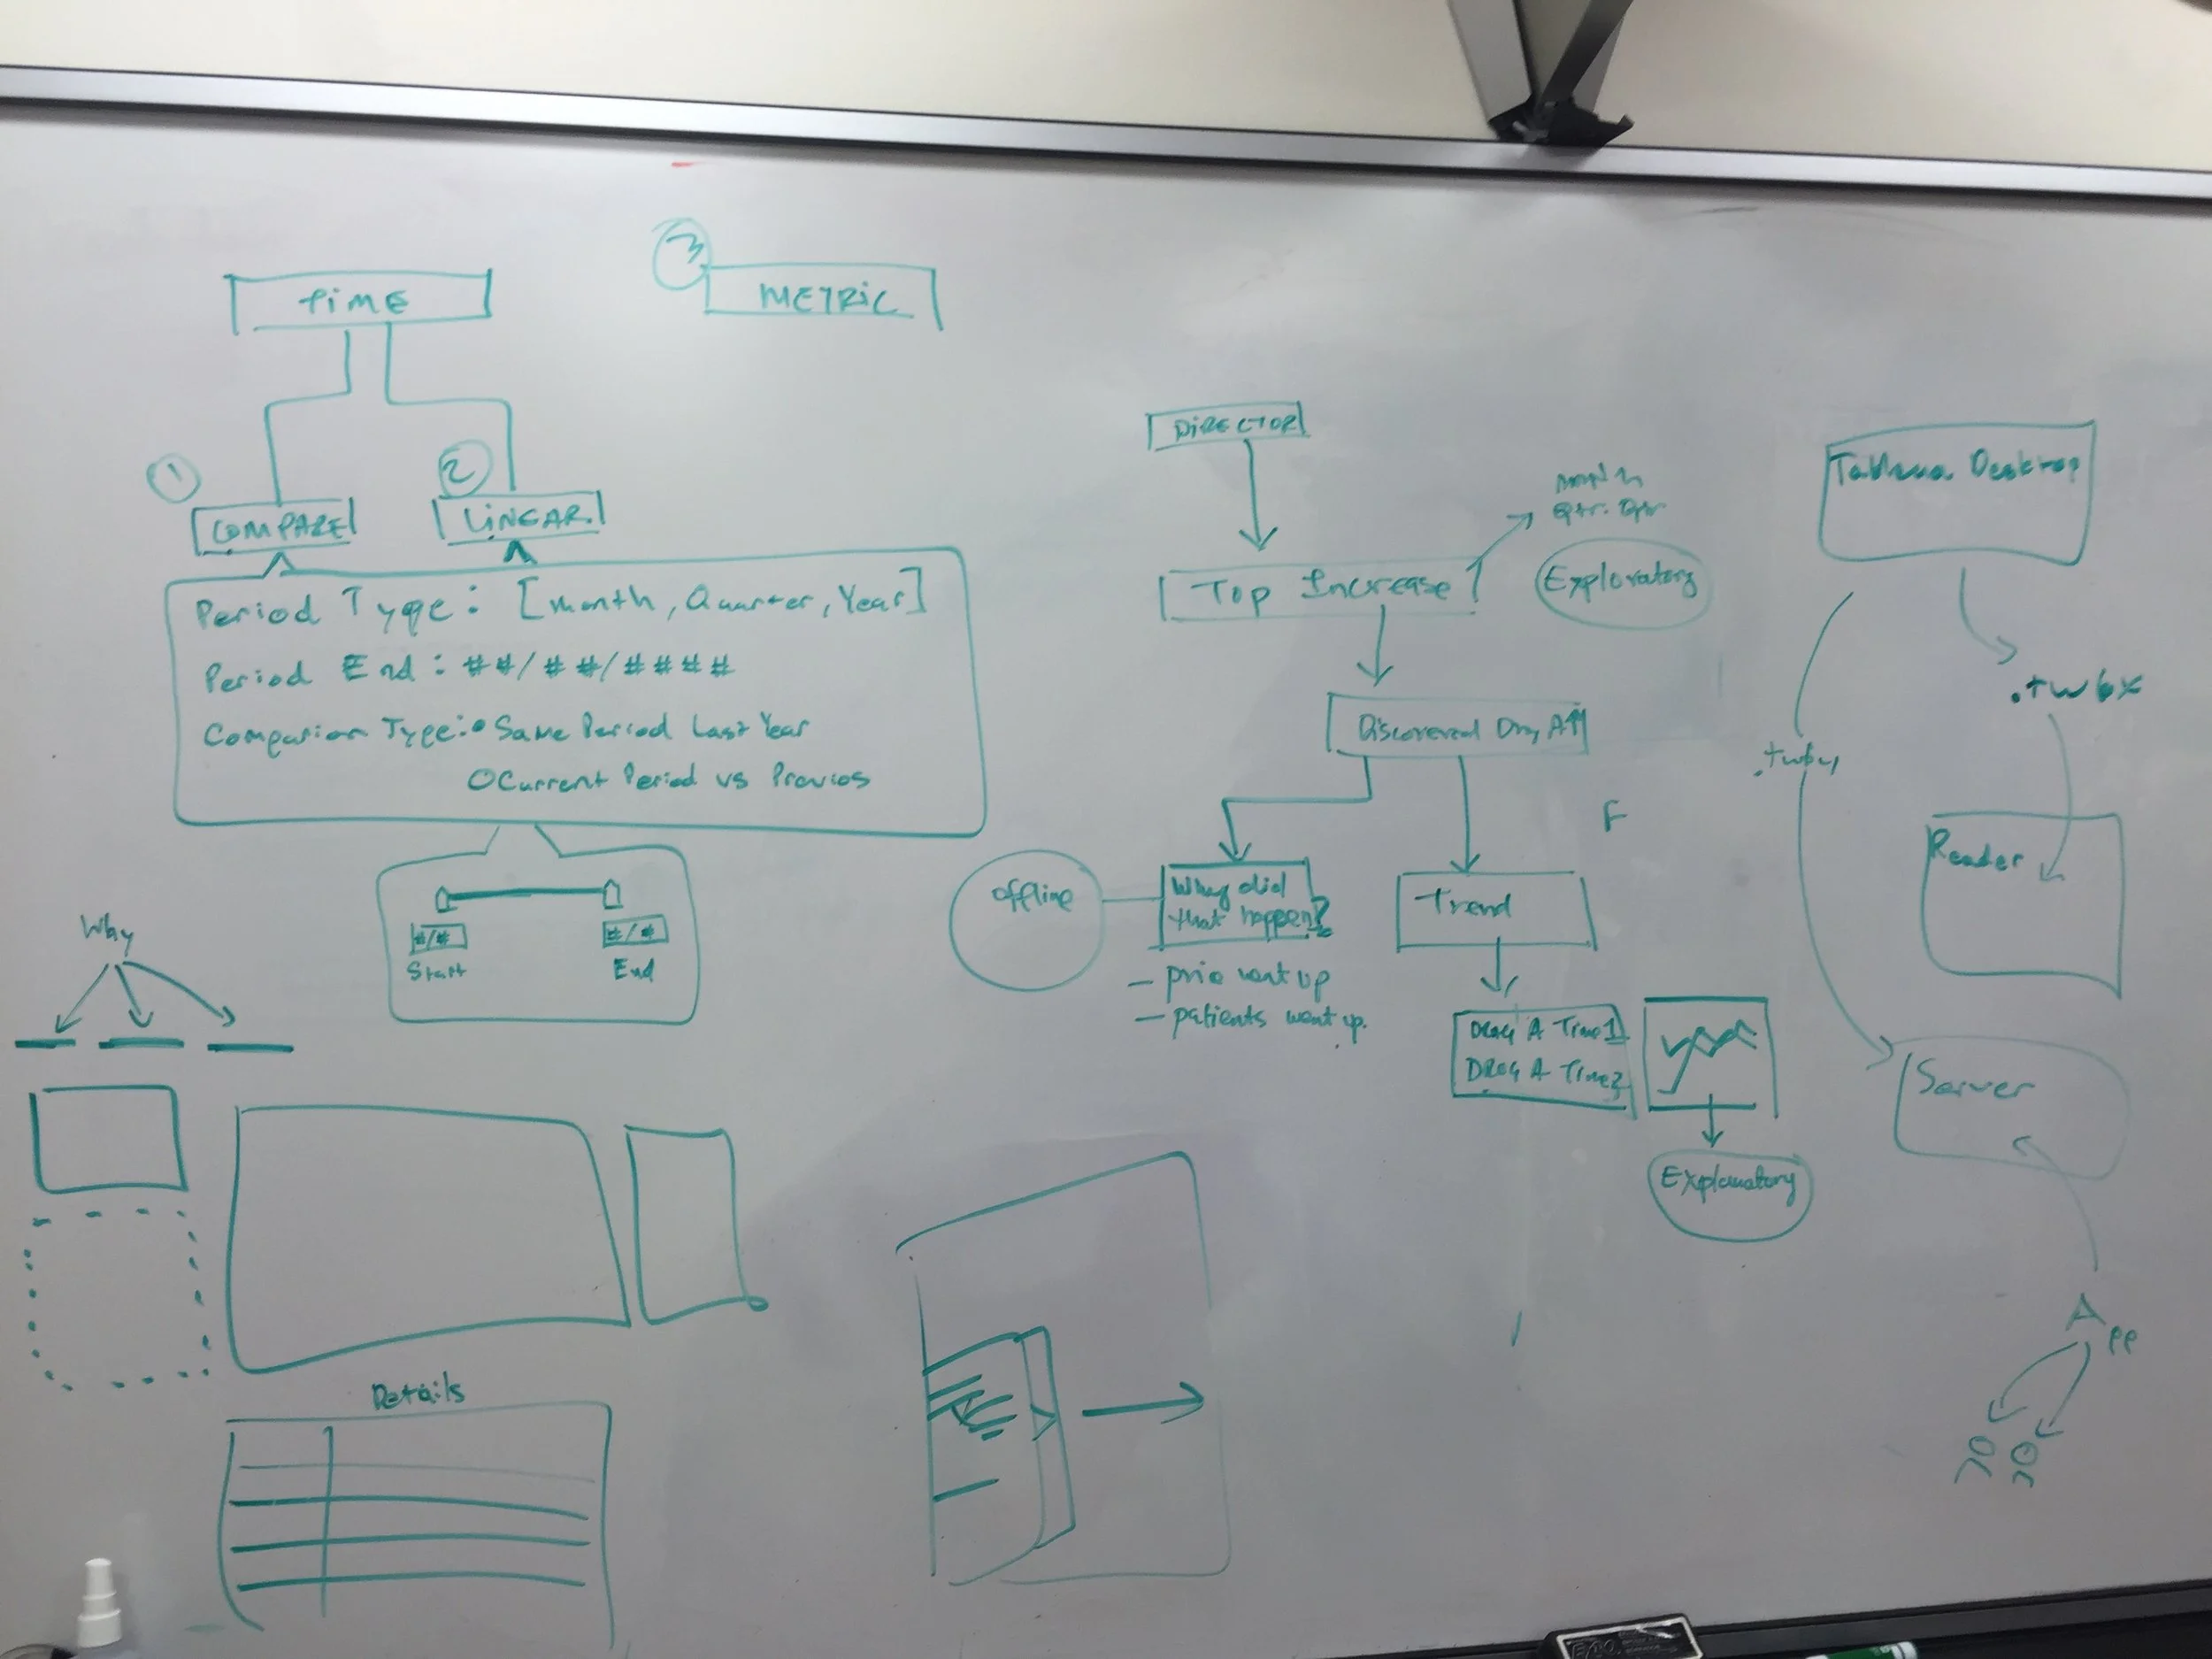
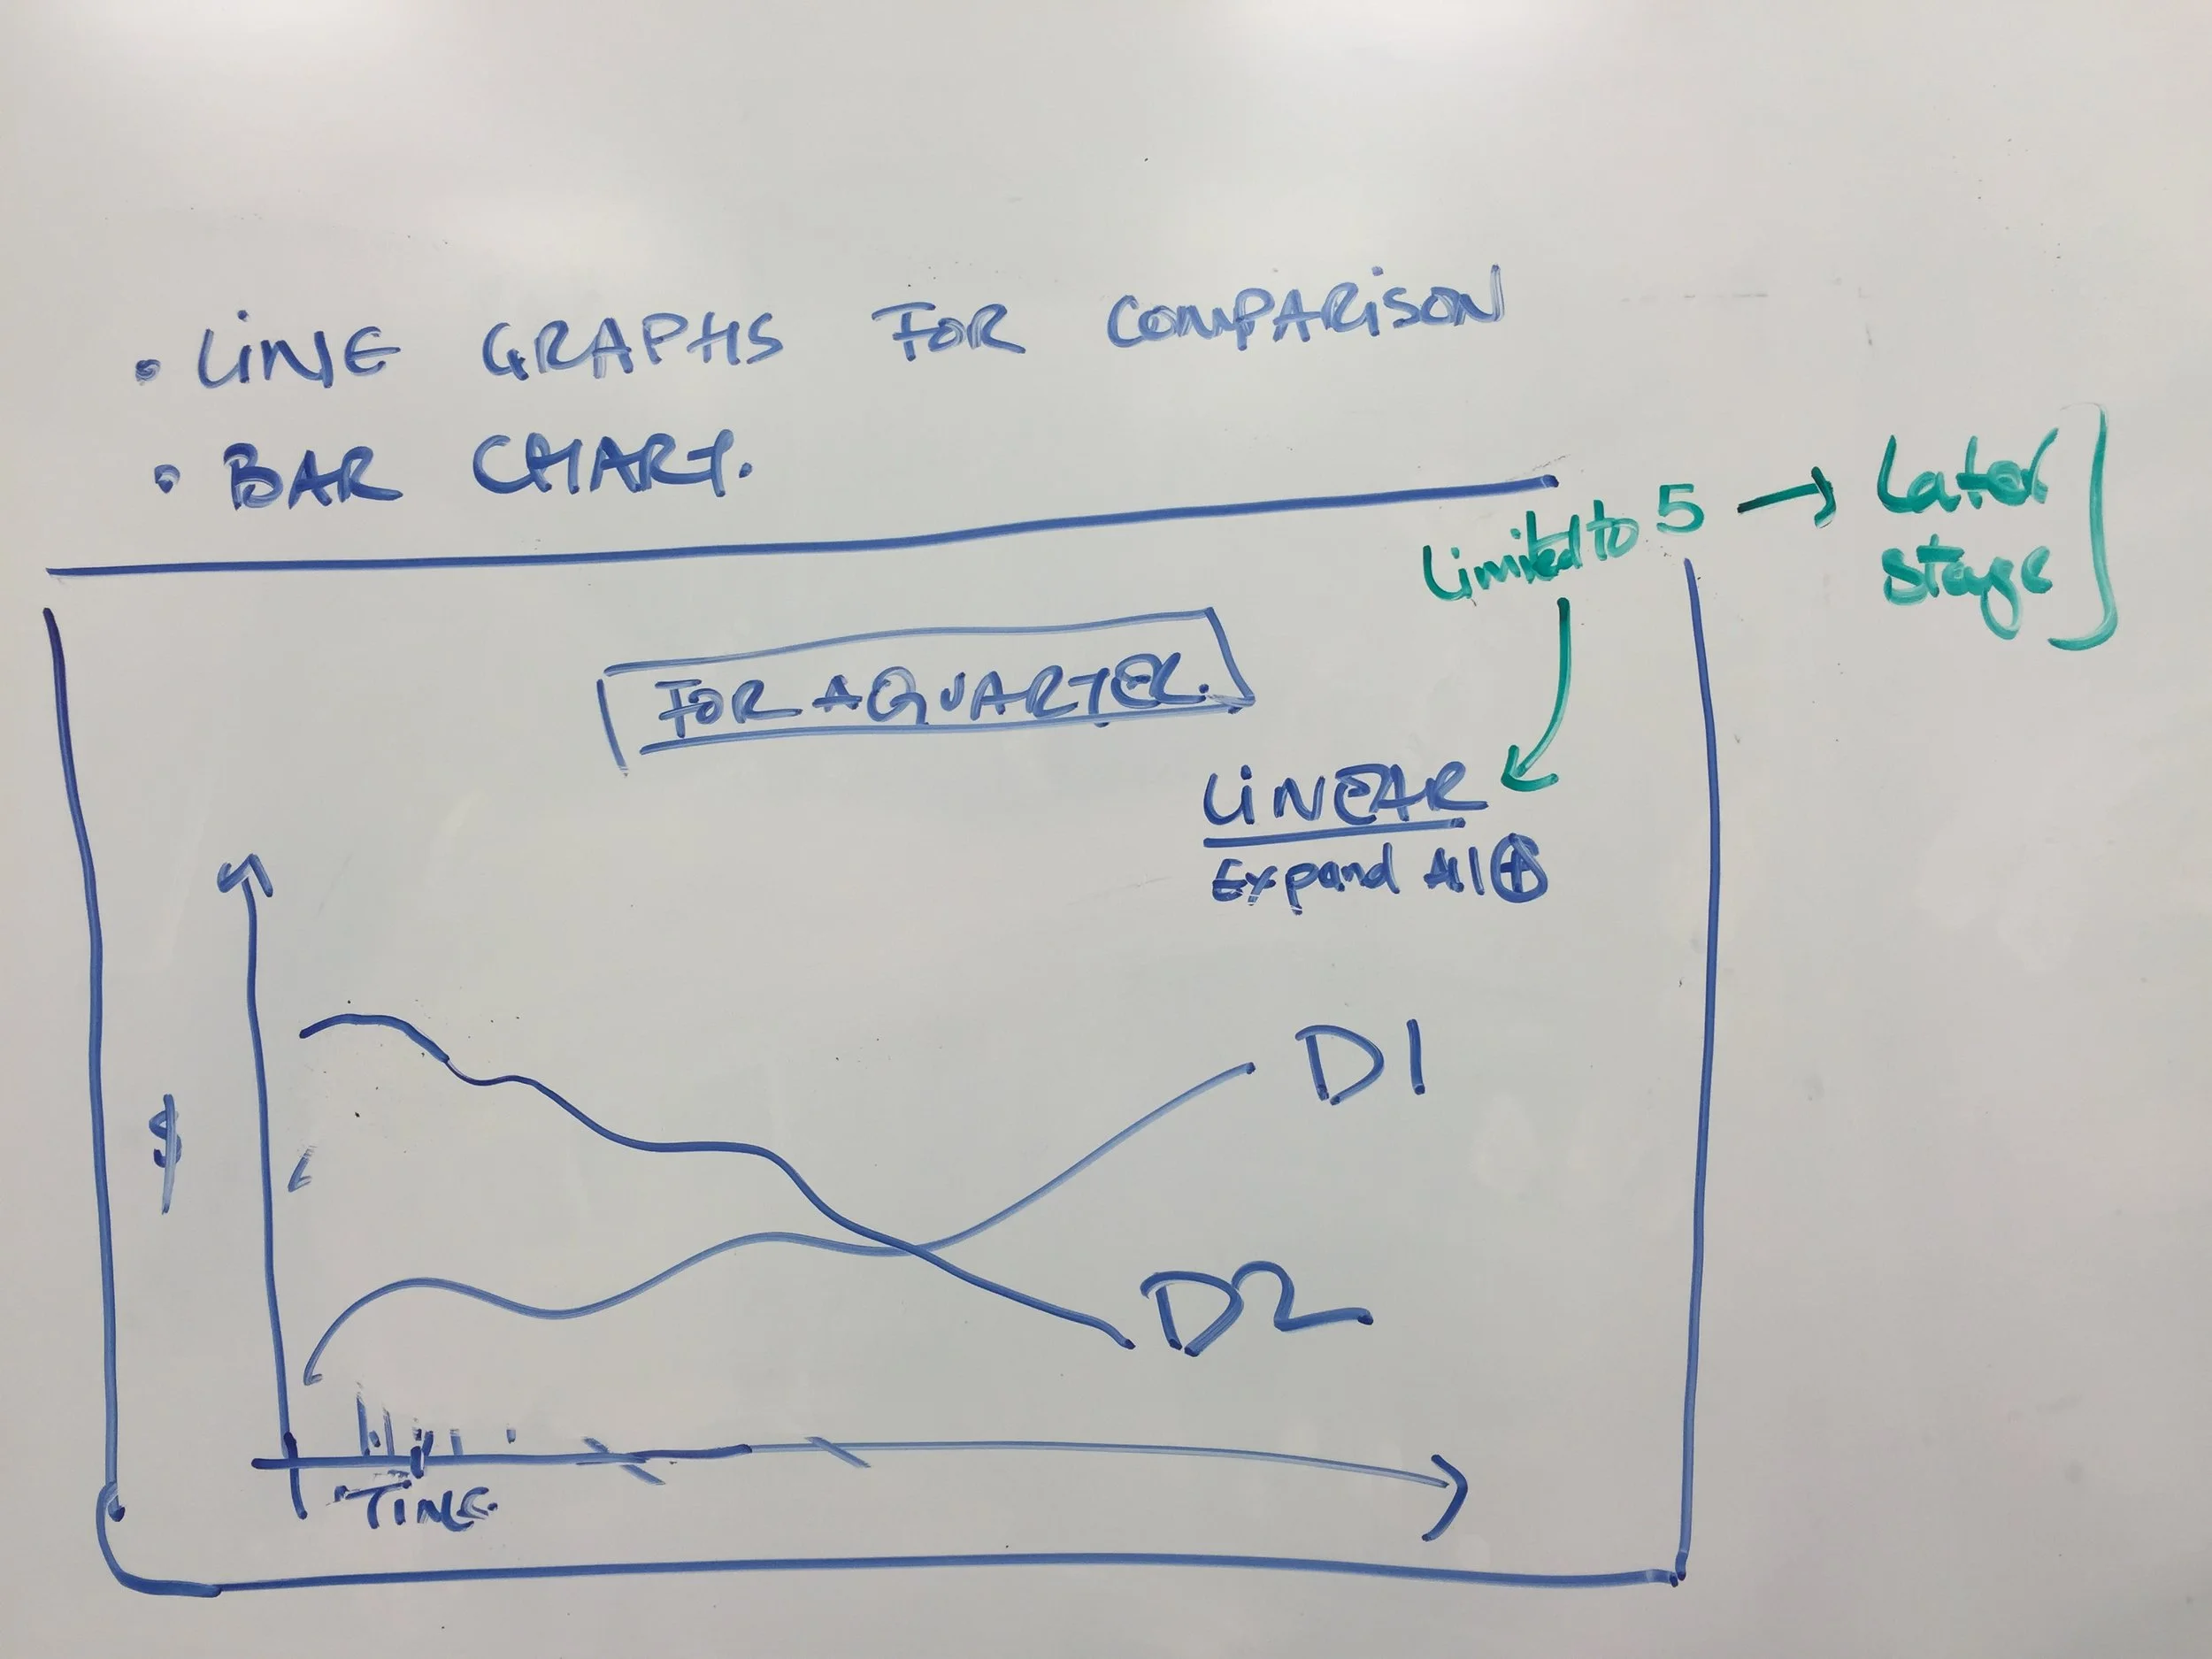
After mapping the current state information architecture and gathering all reporting mechanism and variations, I started to explore possible ways of structuring some reporting methods in a interactive and real-time reporting processes. I was quickly able to get feedback on these ideas from our data scientist and SME to get direction.
Paper prototyping and initial feedback
I used paper prototype initially to test and get feedback from our stakeholder who was also a user of the legacy tool. We were able to shift our thinking to a more structured and interactive tool and talk about the most important part of the tool that involved designing a complex selection and filtering mechanism that was simple enough to use but also flexible to provide granular control to narrow down searches and reporting down to an pharmacy item.
Design Workshop
Paper prototype led to a 2 day design workshop where our team of product manager, data scientist, SME and me (the designer) locked ourselves in a meeting room to work through meaningful metrics and pre-established personas that were going to use this product. We created dashboards that could solve a director level inquiry who would look at high level roll ups on pharmacy spends across one or multiple medical facilities. The other scenario was for an individual pharmacist who might be looking at a specific supply category like adhesive bandages and figuring out purchasing patterns and predict season needs saving them from over or under ordering supplies.
New IA
Dynamic, direct filtering and sorting capabilities drastically cut down on the intense wizard that existed in the previous tool. Users with an idea of what they were looking for could quickly get to a page that met their needs and also allowed them to explore new data that was previously impossible.
Hi-fidelity mockups
Usability test Findings
Final Specification and red-line deliverables
Our front-end and back-end developers were remote working from our Seattle office. We kept close collaboration and provide them with as much information as possible to create designs.
*Pre-Invision/Zeplin era


